Intangible Intensity Benchmarking
- May 6, 2025
- 3 min read
Updated: Jul 21, 2025
How value is shifting beneath the surface in Australia, New Zealand, Singapore and beyond.
Intangible assets have quietly become the dominant drivers of enterprise value.
From brand equity and software to data, IP and customer relationships, these hidden elements now account for the majority of what makes a company valuable yet they’re often nowhere to be seen on a balance sheet.
In this first benchmarking report from QANTM Valuations, we analysed over 1,300 of the largest public companies across Australia, New Zealand, Singapore, Europe, and the USA. The findings uncover a significant global blind spot - one that compromises investment decisions and strategy.
Here’s a snapshot of what we found.
The Global Blind Spot: USD 66 Trillion in Value, Mostly Hidden
Across all five regions analysed, intangible assets now make up 84% of total enterprise value - yet only 15% of that value is visible in reported financials. That leaves a staggering USD 57 trillion unaccounted for.
While the USA leads with 94% intangible intensity, Australia sits at 65%, New Zealand at 47%, and Singapore at just 29%. The differences are partially driven by industry mix, but not entirely.
Are US companies better at creating, protecting and monetising intangible assets - or simply better at recognising them?
This gap matters. When critical value drivers are hidden from view, boards, investors and acquirers are forced to make decisions with incomplete information.
Australia’s Intangible Asset Landscape
In Australia, the contribution of intangibles is significant - and rising. Our analysis reveals a national intangible intensity of 65%, led by sectors like Financial Services, Life Sciences, and Technology.
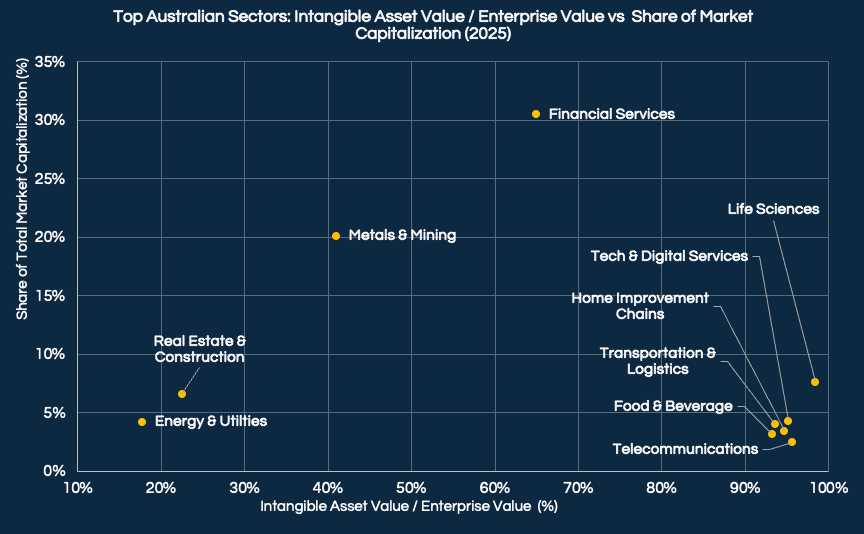
However, more than USD 1.2 trillion of intangible value across Australian companies remains unreported. Even asset-heavy sectors like Metals & Mining show high levels of off-balance sheet value, challenging long-held assumptions about where intangibles live.
For Australian businesses, there's a clear opportunity to better capture, report, and leverage these hidden assets.
Sector-by-Sector: A Wide Range in Intangible Intensity
Not all sectors behave the same. While industries like Packaged Software and Pharmaceuticals are predictably high in intangible intensity (often over 95%), others are far more variable.
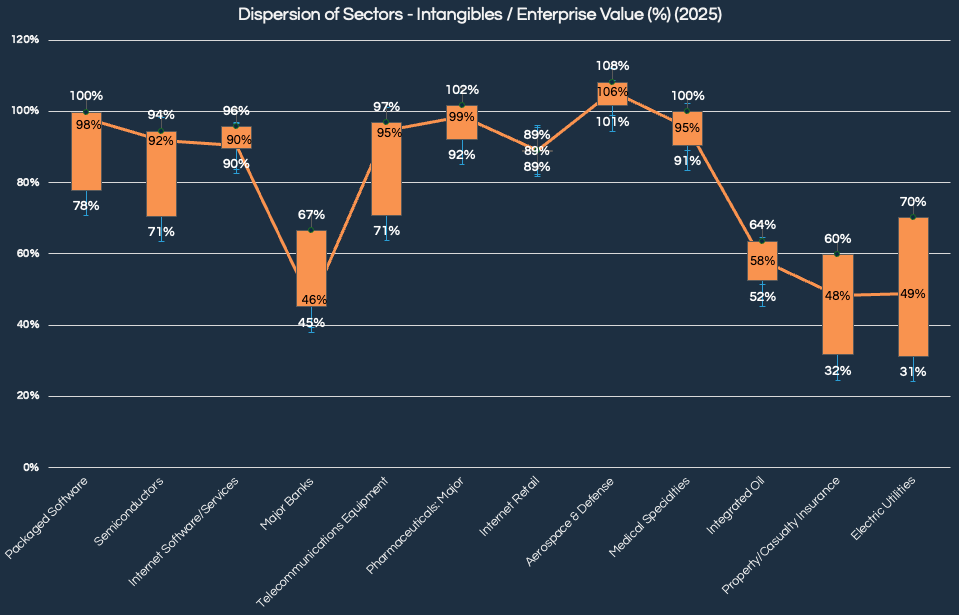
For example, Utilities, Integrated Oil, and Banking show broad spreads with some companies heavily reliant on intangibles and others barely tapping into them.
This inconsistency raises questions about internal capability, business models, and whether the market is fully recognising the drivers of value across comparable companies.
In short: two companies in the same industry can have wildly different levels of intangibles – and very different market performance.
Financial Services - Intangible Leadership and Lag
In Financial Services one of the largest and most influential industries in the region - the differences in how companies harness and report intangible value are stark.
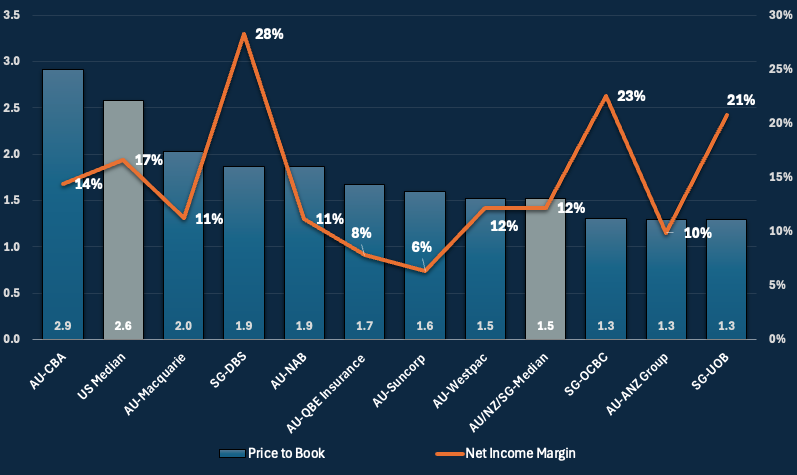
Australia’s CBA stands out as a local leader, with an intangible intensity of 74%, closely mirroring the US median of 73%. But beyond that, the gap grows.
The AU/NZ/SG median intangible intensity is just 51%, with most of that value remaining unreported.
Price-to-Book ratios are considerably lower than in the US - the median is 1.5x in the region versus 2.6x in the US.
Net income margins also trail the US benchmark of 17%, with only a few regional standouts like DBS (28%) and OCBC (23%) performing competitively.
Takeaway: Across industries, intangibles like data, technology and brands are the true drivers of competitive advantage. Our research suggests that US companies are better at creating, protecting and monetising intangible assets.
Want to Go Deeper?
This is just the beginning. The full Intangible Intensity Benchmarking report includes:
Company-level analysis across 1,300+ companies
Regional breakdowns of 28 industries
Over 90,000 datapoints
Charts, earnings multiples, and margin benchmarking
Forward-looking implications for valuation, M&A and strategy
Download the full report to explore how intangible value is shifting globally and how your business can respond.


Comments